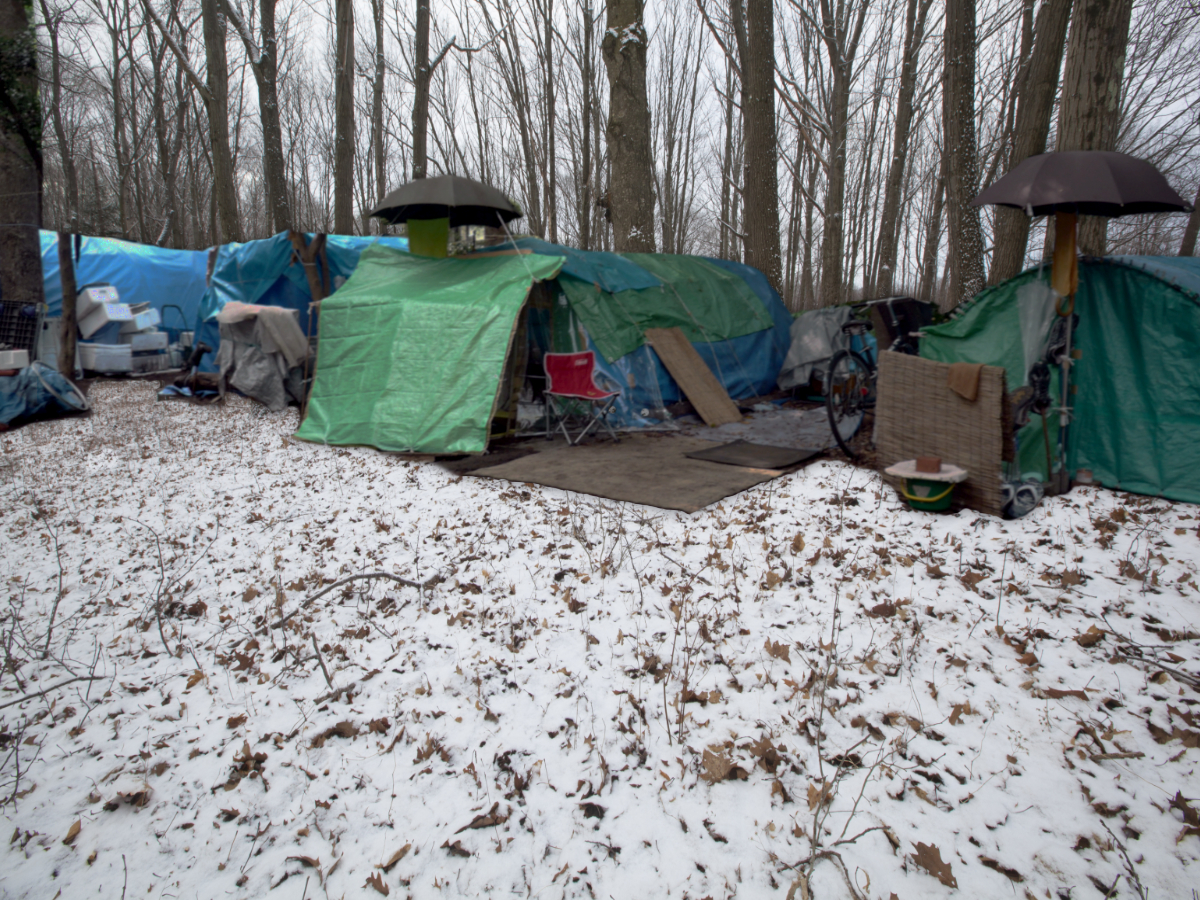
Above: Homeless Camp, photo by Cory Doctorow, via flickr (CC BY-SA 2.0); background: snow covered landscape, Shutterstock.
Income inequality drives hundreds of people into homelessness on any given night in dozens of communities across the U.S., finds new research in The Annals of the American Academy of Political and Social Science.
A community of 740,000 people where income disparities have risen sharply over the past decade can expect over 550 additional people to experience homelessness on a given night, the researchers report in their paper, “A Rising Tide Drowns Unstable Boats: How Inequality Creates Homelessness.”
The findings may not surprise residents of expensive cities like New York, where, according to federal data, 13% of the nation’s homeless population lives. West coast cities with high housing costs, like Los Angeles, San Francisco, and Seattle, also have well-documented homelessness crises.
The new research is among the first to parse the specific ways income inequality affects homelessness at the local level.
“Ultimately, income inequality is pricing lower-income households out of housing markets,” says lead author Thomas Byrne, an assistant professor at Boston University who studies housing.
Income inequality refers to the earnings gap separating those who earn the most money and those who earn least. Income is separate from wealth, which is accrued through stock market investments, real estate, and other avenues apart from wages earned for work and other taxable income.
The value of an owned home doesn’t count as income. Neither do noncash public aid benefits, like supplemental nutrition cards and housing subsidies.
Imperfect data on homelessness
Roughly 580,000 people experience homelessness in the U.S., according to the federal Department of Housing and Urban Development’s 2020 annual report to Congress.
National homelessness figures are imprecise because they’re based on an annual count taken on a single night in late January. A homeless person is someone who “lacks a fixed, regular, and adequate nighttime residence,” according to the report.
About 60% of counted homeless people are in shelters while 40% are unsheltered and living, for example, on the street, in a park, vehicle, or abandoned building.
“Rent is getting too high to live,” one Seattle renter said in 2017, responding to a survey from the city’s Seattle Women’s Commission and the King County Bar Association’s Housing Justice Project, which offers free legal help to local renters facing eviction.
While the overall count of homeless people is down 10% since the federal agency’s first count in 2007, the authors of the new paper note rising homelessness in some large communities has driven upticks in the national tally since 2016.
HUD counts homeless people living within nearly 400 geographies known as continuums of care. It’s easiest to think of a continuum of care as a network of service providers, including nonprofit organizations and government agencies, addressing issues of homelessness within and sometimes across regions. Staff at those providers, as well as local volunteers, conduct the annual one-night count.
Some cities, like New York and St. Louis, are their own continuums of care. For other places, like Denver, the continuum of care includes the metropolitan area. In less densely populated areas — Montana, North Dakota and Delaware, for example — a whole state might be a continuum of care.
HUD’s data is flawed in other ways. Academic researchers have noted the agency doesn’t report measures of uncertainty, such as error margins, and that some people without homes are not included in the homelessness count because it happens only one night.
Still, it’s the most comprehensive current data available on homelessness in the U.S., and it is regularly used in research on housing and homelessness.
Unequal growth in inequality
The authors of the new paper estimate a Gini coefficient, a widely used measure of income distribution, for 239 continuums of care from 2007 to 2018. Those communities accounted for 77% of people experiencing homelessness on any given night in 2018.
The authors exclude communities with fewer than 65,000 people because recent yearly Census Bureau estimates on median household income, median rent and other factors associated with homelessness are not available for smaller communities.
The Gini coefficient often is expressed on a scoring scale of 0 to 100. A score closer to 0 indicates less inequality, while a score closer to 100 means more inequality.
The national Gini coefficient closely tracks with the share of income the top 10% of earners take home, according to the authors.
The average Gini score was 44 across all years and communities studied.
Income inequality increased 0.37 points, about 1%, over the decade studied, but varied widely for individual communities. About one-third of communities saw their estimated Gini score increase by more than one point, over twice the average rate of growth for the communities studied.
Bigger cities and their surrounding areas that experienced a relatively larger increase in income inequality include Baltimore, Chicago, Cleveland, Detroit, Las Vegas, Miami, New Orleans, St. Louis and Philadelphia.
Smaller communities in the same category include Amarillo, Texas; Burlington, Vermont; Camden, New Jersey; Chico, California; DeKalb, Illinois; Lakeland, Florida; Portsmouth, Virginia; Tuscaloosa, Alabama; Utica, New York; and Worcester, Massachusetts.
The full list is available here.
The average community in the authors’ dataset had a population of 740,000 — roughly the size of Seattle.
For a community that size, a one point increase in the Gini score is associated with 562 additional people not having a home on any given night, the researchers find.
‘We can make a lasting impact’
The American Rescue Plan, which President Joe Biden signed into law March 11, includes $5 billion in grants to help state and local governments reduce homelessness.
The goal is to get “as many as 130,000 people off the streets” over the next 12 to 18 months, HUD Secretary Marcia Fudge said during a March 18 press briefing.
“If we’re strategic about how those funds are used, we can make a lasting impact,” Byrne says.
His new paper, written with University of Southern California associate professor Benjamin Henwood and California State Polytechnic University assistant professor Anthony Orlando, could be instructive.
The authors examine two ways income inequality might drive homelessness.
The first has to do with what people spend on housing.
Housing supply typically can’t keep up with housing demand in cities. There’s “an urban renaissance,” Orlando wrote in his 2018 doctoral dissertation, “and housing is not being built fast enough.” Zoning and land-use regulations are two big reasons housing supply can’t keep up.
What happens when housing supply can’t keep up with demand? Prices go up.
That raises the odds that people who make less money will become housing-cost burdened, meaning they spend more than 30% of their pretax income on housing. Some people will pay more to stay in their homes, while higher prices will drive others out of their homes.
Housing researchers have noted limitations of the 30% threshold — though, from an analytical perspective, it is “a helpful way of establishing a binary relationship from which the research can then distinguish households who are cost-burdened from those who are not,” as the authors of a recent paper on rural housing burdens wrote.
The second way income inequality might drive homelessness has to do with the pace housing prices increase. Economically booming communities attract high-income, high-skill workers, who quickly drive up the price of housing, according to the authors.
Their analysis most strongly links rising income inequality with the housing-cost burden, rather than how fast housing prices rise, though the authors call this finding “tentative” and stress more research is needed.
Still, they write that “while many housing policy advocates focus on slowing the growth of housing prices, this strategy alone is unlikely to be sufficient in preventing homelessness. It is important to include policies that increase the ability of low-income households to afford housing — for example, increasing the minimum wage, public benefit levels, and the supply of Section 8 Housing Choice Vouchers.”
The authors further stress their findings “point to the importance of local, as distinct from national, inequality.”
But Byrne says there’s one thing the federal government could do to vastly reduce homelessness: make sure everyone who needs a housing choice voucher gets one.
Section 8, also known as the Housing Choice Voucher Program, is the federal government’s biggest effort to help people with low income rent safe housing. The program subsidizes 70% of monthly rent and utilities for families that make less than half the median income for the county or metropolitan area where they live.
While about 2.2 million households use federal housing choice vouchers, eligible households aren’t automatically enrolled, and about three-quarters of eligible households don’t use them.
One study of voucher program take-up looked at more than 69,000 households offered a voucher and found 48% used them. There are a variety of reasons, including landlords who won’t accept vouchers and not enough voucher supply.
“It seems trite to say, but homelessness is a problem rooted in affordability, and income inequality effectively makes it more difficult for individuals to afford housing,” Byrne says. “Helping them afford housing is a logical and sound response. The thing that would have the biggest impact on reducing homelessness would be to make Section 8 universally available to everyone who’s eligible.”
This article first appeared on The Journalist’s Resource and is republished here under a Creative Commons license.





For more about the causes, costs and consequences of homelessness, visit thehomelesscount.org